PCMark04 Preview review
|
The Pro and commercial version The Pro and commercial version can be bought at PCMark his website for $19.95 for private use and $199.95 for business use. They include more tests and options that are not available in the free version. CPU Test suite The CPU test is a collection of tests that stress the processor of a PC. It includes 9 different tests. Some tests are run multithreaded : 
Memory Test Suite The memory test suite is a collection of tests that isolate the performance of the memory subsystem. The memory subsystem consists of various devices on the PC. This includes the main memory, the CPU internal cache (known as the L1 cache) and the external cache (known as the L2 cache). As it is difficult to find applications that only stress the memory, Futuremark explicitly developed a set of tests geared for this purpose. The tests are written in C++ and assembly. They include: _ Reading data blocks from memory _ Writing data blocks to memory _ Performing copy operations on data blocks _ Random access to data items _ Latency Depending on the size of the data blocks, the tests use the main memory, L2 cache or L1 cache. Before each test, cache cleanup procedures are performed to prevent the cache contents from affecting the results. The read, write, and copy tests in the default setup use data blocks of 8 Megabytes and 4 Megabytes for the main memory and 192 Kilobytes for the L2 cache and 4 Kilobytes for the L1 cache. The test is run continuously for 5 seconds and Megabytes of data processed per second is given as the result. These memory tests are optimized differently depending on the platforms to report the best result. The random access test uses a large list of data items. The size of each data item in the list is 64 bytes. The list is unsorted (or sorted using a pseudo-random key). Because of this setup, accessing each consecutive item in the list represents a random access operation. The list is iterated through as many times as possible in 5 seconds and Megabytes of items accessed per second are given as the result. Again, 8 Megabytes and 4 Megabytes lists used for the main memory and 192 Kilobytes for the L2 cache and 4 Kilobytes for the L1 cache in the default setup. This test suite, besides the block sizes mentioned, also includes additional block sizes for more testing. The latency tests are theoretical tests and are meant to isolate the performance a particular part of the memory subsystem. They measure the time it takes to access data memory. These tests use data blocks of 16 Megabytes for main memory, 192 Kilobytes for the L2 cache, and 4 Kilobytes for the L1 cache. The results are in Nanoseconds needed to access the data. Note that latency results are not included in the overall memory score. Graphics Test Suite 2D Tests Transparent Windows: This test measures the performance of typical windowing operations of your PC. The test uses a workspace of 1024 x 768 with 32-bit color precision. Ten windows are created, each with its own moving and fading speed. Each of the windows is created fully visible and its alpha-blending value is first reduced and then increased to make a fading effect. Fading is a newer Windows® feature, which enhances the visual content of programs. User can set their own preferences for applications for highlighting certain dialogs. The result for this test is the Average Number of windows drawn per second. Graphics Memory: These two tests are the same as the Graphics Memory test in the system test suite. They only differ in the number of scan lines drawn per second during scrolling. These tests draw 16 and 32 scan lines per second. Video Playback Tests: This test measures the performance of playing back video files. There are two tests: one plays back WMV content and the other DivX content. The WMV file has a resolution of 1024 x 768. In this test it is decoded through Windows Media Player. The file data is first passed through a MPEG1 splitter, followed by a MPEG Decoder, and finally the Video Renderer. The DivX file has a resolution of 640 x 480. During the test it is decoded through DivX codec. The file data first goes through an AVI Splitter, followed by a DivX Decoder, and finally the Video Renderer. The videos are played back at the highest rate possible. The result is in frames per second. 3D Tests Fill Rate Tests: The fill rate is the speed at which your graphics hardware is capable of drawing textures onto 3D objects. These tests report results in million of texels drawn per second (MTexels/s). Texels or texture elements are the pixels in the source texture. PCMark draws a number of large surfaces covering the entire screen and apply textures to these surfaces using fixed function pixel processing. Alpha blending is also used for transparency. There are two fill rate tests. Single-Texturing: This test measures single-texturing performance – how fast the graphics card is capable of drawing single textures onto 3D objects. A single texture is applied to each of 64 objects. This means that the graphics hardware must fill each of these objects separately, irrespective of how many texture layers the card is capable of drawing in a single pass. Multi-Texturing: This test measures multi-texturing performance – how fast the graphics card is capable of drawing multiple textures onto 3D objects. Multiple textures are applied to an object in a single pass until a total 64 textures have been applied. This test benefits from the use of modern graphics cards, which are capable of applying several textures in a single pass. For example, if a graphics card is capable of applying 6 texture layers in a single pass, 6 textures will be applied to an object in 10 passes and the remaining 4 textures will be applied in the 11th pass. Note that fixed pixel texturing has an upper limit of 8 textures per pass. So, even modern DirectX® 9 hardware, capable of up to applying 16 textures per pass, will not be able to apply more than 8. Polygon Throughput Tests: Polygon throughput is a measure of the ability of your graphic hardware to process 3D graphics primitive objects. The tests report results in millions of triangles drawn per second (MTriangles/s). The scene is a real-time rendering containing a large number of polygons and no texturing. Specular lighting is also used. There are two polygon throughput tests representing a different kind of 3D content. Single Light: For this test the program uses only a single directional light source. Multiple Lights: For this test we use 8 directional light sources. 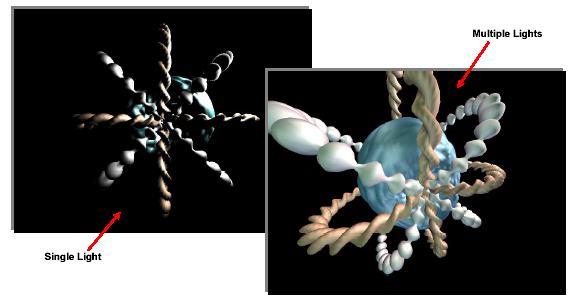
Hard Disk Test Suite The hard disk drive test suite is a collection of four tests that isolate the performance of the hard disk. The hard disk is an important part of the PC providing quick access to large amounts of data. Today’s computers come with hard disks that can store several billion bytes (gigabytes) of data. For these tests they use RankDisk, an application developed and copyrighted by Intel®. RankDisk is used to record a trace of disk activity during usage of typical applications. These traces can then be replayed to measure to performance of disk operations for that usage. RankDisk records disk access events using the device drivers and bypasses the file system and the operating system’s cache. This makes the measurement independent of the file system overhead or the current state of the operating system. In replaying traces, RankDisk always creates and operates on a new “dummy” file. This file is created in the same (or closest possible) physical location of the target hard disk. This allows the replaying of traces to be safe (does not destroy any existing files) and comparable across different systems. Due to the natural fragmentation of hard disks over time, they should be defragmented before running these tests. The traces used for each test were created from real usage. The following four input traces are used: Windows XP Startup: This is the Windows® XP start trace, which contains disk activities occurring at operating system start-up. This trace contains no user activity. Application Loading: This is a trace containing disk activities from loading various applications. It includes opening and closing of the following applications: _ Microsoft® Word _ Adobe® Acrobat® Reader 5 _ Windows® Media Player _ 3DMark 2001SE _ Leadtek® Winfast® DVD _ Mozilla Internet Browser File Copying: This trace simply contains disk activities from copying approximately 400 Megabytes of files. General Hard Disk Drive Usage: This trace contains disk activities from using several common applications. These are: - Opening a Microsoft® Word document, performing grammar check, saving and closing - Compression and decompression using Winzip - Encrypting and decrypting a file using PowerCrypt - Scanning files for viruses using F-Secure® Antivirus. - Playing an MP3 file with Winamp - Playing a WAV file with Winamp - Playing a DivX video using DivX codec and Windows® Media Player - Playing a WMV video file using Windows® Media Player - Viewing pictures using Windows® Picture Viewer - Browsing the internet using Microsoft® Internet Explorer - Loading, playing and exiting a game using Ubisoft Tom Clancy’s Ghost Recon Disk idle times were compressed to 50 milliseconds to speed up the playback time. Our studies showed that 50 milliseconds was the smallest idle time interval that didn’t affect the test results. The results of these tests are in Megabytes processed per second. |
 Previous Page (2/5)
Added: November 25th 2003
Product reviewed: PCMark04 Preview
Reviewer: LSDsmurf
Score: 10/10
Page: 3/5